Data Clarifications
Below you will find clarifications about some of the data that can be retrieved from Frost.
Standard time offsets
Some elements are historically measured and aggregated at specific times during the day. This is indicated by the timeOffset value. Sometimes multiple timeseries are available at the same station, with the only difference being the timeOffset value.
The table below is a guideline for what to choose when in doubt. The timeOffset values listed are the most typical values used at MET Norway's own stations.
For automatic filtering according to this table, see the concepts page
| element_id | timeResolution | Preferred offset | Why |
|---|---|---|---|
| max(air_temperature P1D) | P1D | PT18H | Standard sampling period for temperature extremes is 19-18 UTC |
| max(air_temperature PT12H) | PT12H | PT6H | This offset indicates our standard timeseries, where the first calculation is performed at 06 UTC |
| min(air_temperature P1D) | P1D | PT18H | Standard sampling period for temperature extremes is 19-18 UTC |
| min(air_temperature PT12H) | PT12H | PT6H | This offset indicates our standard timeseries, where the first calculation is performed at 06 UTC |
| snow_coverage_type | P1D | PT6H | Standard sampling time for snow observations is 06 UTC |
| sum(precipitation_amount P1D) | P1D | PT6H | Standard sampling period for precipitation is 07-06 UTC |
| sum(precipitation_amount P1M) | P1M | PT6H | Standard sampling period for precipitation is 07-06 UTC |
| surface_snow_thickness | P1D | PT6H | Standard sampling time for snow observations is 06 UTC |
| Other elements | Other resolutions | PT0H | For cases not listed above, PT0H is always the preferred offset when multiple offsets are returned. |
Quality code
The data is run through a quality control system that can assign several quality flags which mean different things. For further information see useinfo and controlinfo.
Frost tries to give the user a single value to represent the general quality of the observation. This value is set in the field qualityCode. Possible values for this code are described in the table below:
| Value | Description (quality status of the observation) |
|---|---|
| 0 | OK, value is controlled and found O.K. |
| 1 | OK, value is controlled and corrected, or value is missing and interpolated |
| 2 | Slightly uncertain, value is not controlled |
| 4 | Slightly uncertain, value is not corrected |
| 5 | Very uncertain, value is not corrected |
| 6 | Very uncertain, model data. Value is controlled and corrected, or value is missing and is interpolated - automatic |
| 7 | Erroneous, value is not corrected |
Flag 1 (useinfo[1] - deviation of original value from normed observation procedure):
| Value | Description |
|---|---|
| 0 | normed observation period and observation time |
| 1 | observation time deviates from the norm |
| 2 | observation period is shorter than the norm |
| 3 | observation period is longer than the norm |
| 4 | observation time deviates from the norm, observation period is shorter than the norm |
| 5 | observation time deviates from the norm, observation period is longer than the norm |
| 8 | original value is missing |
| 9 | status information not given |
Flag 2 (useinfo[2] - quality level of the original value):
| Value | Description |
|---|---|
| 0 | original value found to be good |
| 1 | original value suspicious (likely correct) |
| 2 | original value suspicious (likely erroneous) |
| 3 | original value definitely erroneous |
| 9 | no quality information given |
Flag 3 (useinfo[3] - treatment of the original value):
| Value | Description |
|---|---|
| 0 | original value is kept unchanged |
| 1 | original value is manually or automatically corrected with a good result |
| 2 | original value is manually or automatically interpolated with a good result |
| 3 | original value is automatically corrected |
| 4 | original value is automatically interpolated |
| 5 | original value is manually created from accumulated values |
| 6 | original value is automatically created from accumulated values |
| 8 | original value is thrown out |
| 9 | quality information is not given |
The final quality code is converted from the three flags according to the following table (the asterisk '*' matches anything):
| Flag 1 | Flag 2 | Flag 3 | Quality code |
|---|---|---|---|
| 1 | 9 | 9 | 5 |
| 4 | 9 | 9 | 5 |
| 5 | 9 | 9 | 5 |
| 8 | 9 | 9 | 5 |
| 8 | 9 | 8 | 7 |
| 0 | 3 | 8 | 7 |
| 2 | 3 | 8 | 7 |
| 3 | 3 | 8 | 7 |
| 8 | 3 | 8 | 7 |
| 9 | 3 | 8 | 7 |
| 3 | 3 | 9 | 7 |
| 3 | 0 | 8 | 7 |
| 0 | 0 | 8 | 7 |
| * | * | 1 | 1 |
| * | * | 2 | 1 |
| * | * | 3 | 6 |
| * | * | 4 | 6 |
| * | * | 5 | 1 |
| * | * | 6 | 1 |
| * | 0 | * | 0 |
| * | 9 | * | 2 |
| * | 1 | 0 | 4 |
| * | 2 | 0 | 5 |
| * | 3 | 0 | 7 |
| * | 3 | 8 | 7 |
Performance and Exposure Categories
Exposure category is used to give information about the quality of the placement of a station. Performance category is used to give information about the quality of a sensor (which is located at a given station).
| Exposure Category | Description |
|---|---|
| 1 | Fulfils all WMO's demands on location |
| 2 | Unknown location, assumed good |
| 4 | Unknown location, assumed bad |
| 5 | Bad location |
| Performance Category | Description |
|---|---|
| A | The sensor type fulfills the requirements from WMO/CIMOs on measurement accuracy, calibration and maintenance. |
| B | Rutines for calibration and maintanance are known. Control of the montage exists. The precision of the measurment is lower than the WMO/CIMO requirements. |
| C | The sensor type is assumed to fulfill the WMO/CIMO requirements. Missing measurement for control, rutines for calibration, or maintanence. |
| D | The sensor type is assumed to fulfill the WMO/CIMO requirements. Some controls show deviations from the WMO/CIMO requirements. |
| E | Less valuable. Possibly useful for extraordinary purposes. Unknown performance |
Explanations for some coded negative value elements
Some elements can use negative observation values that are coded to mean a certain thing - and are not an actual value for a measurement. Product time series also exist where these special values are converted to a measurement value. Below you will find a table with explanations of these values.
| Observation value | element ID | Converted value | Description |
|---|---|---|---|
| -3 | wind_from_direction | not converted | No unique wind direction is given when winds are weak |
| -3 | cloud_area_fraction | not converted | Cloud cover is not estimated because of fog or analogous phenomena |
| -3 | low_type_cloud_area_fraction | not converted | Cloud cover is not estimated because of fog or analogous phenomena |
| -3 | cloud_area_fraction1 | not converted | Cloud cover is not estimated because of fog or analogous phenomena |
| -3 | cloud_base_height | not converted | Cloud height is not estimated because of fog or darkness |
| 0 | surface_snow_thickness | not converted | Snowdepth less than 0.5 cm |
| -1 | surface_snow_thickness | not converted | Zero snowdepth or partial snow cover |
| -3 | surface_snow_thickness | not converted | Not possible to measure snowdepth |
| -1 | max(surface_snow_thickness P1M) | not converted | Zero snowdepth or partial snow cover |
| -1 | min(surface_snow_thickness P1M) | not converted | Zero snowdepth or partial snow cover |
| -1 | snow_coverage_type | not converted | No snow in station area |
| -1 | min(snow_coverage_type P1M) | not converted | No snow in station area |
| -1 | max(snow_coverage_type P1M) | not converted | No snow in station area |
| -1 | state_of_ground | not converted | No snow or ice cover in the station area |
| -1 | sum(precipitation_amount PT6H) | not converted | No precipitation |
| -1 | sum(precipitation_amount PT12H) | not converted | No precipitation |
| -1 | sum(precipitation_amount P1D) | 0.0 mm | No precipitation |
| -1 | sum_over_undefined_period(precipitation_amount PT1H) | not converted | No precipitation |
| -1 | max(sum(precipitation_amount P1D) P1M) | 0.0 mm | No precipitation |
| -1 | sum(precipitation_amount P30D) | 0.0 mm | No precipitation |
| -1 | sum_until_day_of_year(precipitation_amount P1D) | 0.0 mm | No precipitation |
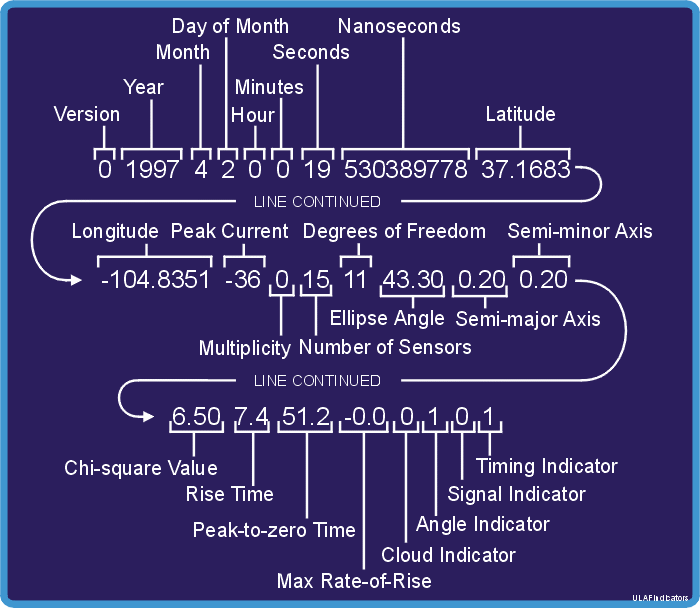
Explanation of the lightning data format
Lightning data is in UALF format: